Friday, November 27, 2020

This week's interesting finds

The "season for sharing" list 

Even though things are different this year, we’re keeping one of our favourite holiday traditions –
the EdgePoint gift list

We believe gift cards and presents from your local restaurant or a business always make a great gift, especially this year. 

Here’s what’s new in the 2020 edition: 

     • Where possible, we added local Canadian retailers in addition to Amazon links 

     • EdgePoint swag – A mask and long-sleeved t-shirt 

     • Recommendations of products made by businesses in our Portfolios 

We hope all of you stay safe during the holiday season. 

Calming investors’ market anxiety 

Morningstar conducted a study to understand how market downturns can affect investors’ decision-making. Specifically, whether particular pieces of advice from a financial advisor could differently affect investors’ engagement with the market during increased volatility. This study turned up three main findings: 

1. There’s power in seeing increased volatility as an opportunity. Most people preferred to either stay put or sell when they faced the story and historical performance conditions. Only when the situation was phrased as an opportunity did the majority of people buy additional stock. 

2. The active stay active. Across all forms of the experiment, participants who self-identified as active investors were approximately 2.4 times more likely to want to buy during a downturn compared with people who didn’t view themselves as investors. 

3. Emotions matter. Participants who reported experiencing positive emotions during the pandemic were more likely to purchase additional assets across all three forms of the experiment. 

These findings suggest that during a downturn it may be more beneficial to help clients reframe their thinking so they feel positive about investing, rather than to simply encourage them to purchase.

Vaccine research and development has improved massively throughout history

Below are the compiled timelines of vaccine development throughout history, from polio to swine flu, to demonstrate how the pace of research has evolved. 


Four valuation metrics using median S&P 500 Index data 


Plunging prices of cheese 


Cheese prices are plunging as Covid’s second wave drives diners from restaurants. The pandemic is forcing U.S. officials to yet again tighten their grip on eating out, and that’s cutting into prices for cheese and other dairy products across the U.S. Some wholesale cheddar prices have fallen more than 40% this month.

Friday, November 20, 2020

This week's interesting finds

This week’s charts

Reversal of equity outflows


The 60/40 portfolio duration risk has risen recently.


Global negative-yielding debt climbed to a record $17.1 trillion, as pandemic-spurred economic damage and monetary stimulus continued to grip bond investors even as news of progress on a vaccine lifted equity markets. 


The % of MSCI World stocks beating the index YoY is up to 39%. 


US equities are at their highest levels on record on a price to sales basis. 


Why value investing still works in markets 

Value investing, defined as buying or selling securities at prices different than their true value, is alive and well. You might not know that by reading headlines in the financial press or witnessing the poor returns of stocks with low multiples of price to earnings or book value per share. 

In recent decades, value investing has come to mean buying stocks with low valuation multiples and selling those with high multiples. However, simply buying stocks with low multiples should not be confused with value investing. 

One reason for the change in how people view value investing may come from Eugene Fama and Kenneth French, professors of finance. They published a much-cited paper which showed that adding measures of size and value to beta righted the relationship between risk and reward. Value investing suddenly became synonymous with buying stocks with low multiples and avoiding or shorting those with high multiples. 

Years later, many investors and market observers still unfortunately conflate value investing with the value factor. Value investing is buying something for less than it is worth. The value factor is an ersatz measure of gaps between price and value. Worse, the relevance of the value factor is fading.

Fundamental value investors should focus on gaps between price and value for individual securities. The present value of future cash flows, not misleading multiples, are the source of value. As Charlie Munger, Warren Buffett’s partner at Berkshire Hathaway, has said: “All good investing is value investing.” The value factor may be floundering, but value investing remains as relevant and useful as ever. 

The Big Lessons From History 

Harry Houdini used to invite the strongest man in the audience on stage. Then he’d ask the man to punch him in the stomach as hard as he could. Houdini was an amateur boxer, and told crowds he could withstand any man’s punch with barely a flinch. The stunt matched what people loved about his famous escapes: the idea that his body could conquer physics. After a show in 1926 Houdini invited a group of students backstage to meet him. One, a guy named Gordon Whitehead, walked up and started punching Houdini in the stomach without warning. 

Whitehead didn’t mean any harm. He thought he was just performing the same trick he saw Houdini pull off on stage. But Houdni wasn’t prepared to be punched like he would be on stage. He wasn’t flexing his solar plexus, steadying his stance, and holding his breath like he normally would before the trick. 

 The next day Houdini woke up doubled over in pain. His appendix was ruptured, almost certainly from Whitehead’s punches. And then Harry Houdini died. The riskiest stuff is always what you don’t see coming. Risk always works like that. In an interview years ago I asked Robert Shiller, who won the Nobel Prize for his work on bubbles, about the inevitability of the Great Depression. He answered: Well, nobody forecasted that. Zero. Nobody. Now there were, of course, some guys who were saying the stock market is overpriced. But if you look at what they said, did that mean a depression is coming? A decade-long depression? No one said that. I have asked economic historians to give me the name of someone who predicted the depression, and it comes up zero. An important lesson from history is that the risks we talk about in the news are rarely the most important risks in hindsight. We saw that over the last decade of economists and investors spending their lives discussing the biggest risk to the economy. This time it was the virus. Out of the blue, causing havoc we couldn’t comprehend.

Friday, November 13, 2020

This week's interesting finds

EdgePoint Videos: Embracing the unknown 

Do you enjoy not knowing what happens next? Other than suspense in movies, people usually prefer feeling like they're in control. But in investing, certainty and comfort are rarely any good. To achieve pleasing long-term returns, investors sometimes need to feel the discomfort of owning businesses that don't offer the short-term peace of mind that most of the market craves. Our latest video explains why successful investors embrace times of uncertainty. 

Latest charts on valuation 

After peaking at +4.5 standard deviations above the mean, the US large-cap valuation spread (the spread in valuations between the cheapest 20% of stocks vs the average stock) has reverted back down to +1.8. Historically speaking this is still a provocative starting point for value. 


The relative trailing P/E of value stocks: 


The relative trailing P/E of the Big Growers: 

After peaking at 5x the P/E of the market, the Big Growers now trade at 3.6x. Historically this group has traded at a relative multiple of around 1.5 – 2.0x. 


Source: Empirical Research Partners Analysis, National Bureau of Economic Research. Big Growers are a group of approximately 75 large-capitalization stocks classified by Empirical Research Partners, LLC to have faster and stronger growth credentials than the rest of the market. Trailing P/E ratios are equal-weighted and relative to the rest of the U.S. large-capitalization universe. 

Unravelling value's decade-long underperformance 

The tendency for value to lag markets for significant periods of time is not historically unusual, and happens whenever a market environment exists where expensive stocks get more expensive; cheap stocks get cheaper; or some combination of both (as we have seen this cycle). Over the past 50 years, it has happened three times in US markets - in the nifty-fifty bubble of the 1960s-early 1970s, in the 1990s dot.com bubble, and over the past decade. In other words, it has happened approximately once every 20 years or so. The only thing unusual about this cycle has been its length and magnitude, which has been somewhat worse than past cycles. 

One of the core reasons that value investing works is that investors systematically overestimate their ability to predict the future. 

A decade ago, investors believed Microsoft was being disrupted by mobile, Apple & iOS, Google Docs and Android. The stock traded for as little as 7x earnings at the time. Suffice to say investors' predictions of Microsoft's imminent demise (a value stock at the time, I might add - something today many people forget) were more than a tad exaggerated. The same can be said of Apple, which was losing money and widely believed to be heading for the bankruptcy courts in circa 2000 - again quite reasonably based on what was knowable at the time - and the stock accordingly traded for less than its net cash. We know how that ended. 

A century of quantitative evidence from market history suggests investors tend to underprice stocks with the most apparently assuredly poor future prospects, and over price those believed to have the most assuredly promising prospects, and there is nothing in the past decade's market experience to suggest that has fundamentally changed. 

What is the smart money saying? 


The impact of successful vaccine rollout on various sectors (“vaccine sensitivity”) 


What's happening with prices? 

While meat inflation (which spiked earlier this year due to supply bottlenecks) is off the highs, prices are still well above last year’s levels. 


And here we have the CPI for cleaning products. 


Fast-food restaurant prices are up sharply. 


Car prices are up. Especially used cars. 


You can buy men’s suits at a much lower price than last year.


Friday, November 6, 2020

This week's interesting finds

This week in charts 

The inverse weight of the Energy sector in the S&P 500 is the best and most consistent explanation of the market's P/E.


Will the election result be a catalyst to change the composition of the S&P 500?


1% out of “Growth and Defense” sectors equates to over 3% increase in Cyclical sectors!


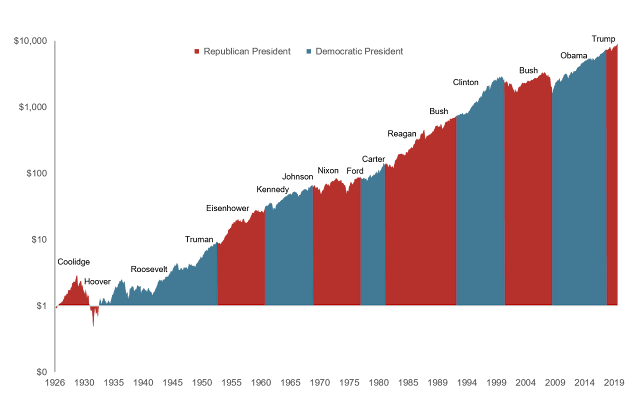
Historically, volatility in the stock market is elevated in the months leading up to an election. This is logical, as the markets hate uncertainty. For investors, it’s important to step back, put personal feelings about politics aside, and objectively assess the situation and what it might mean for your personal finances.


Stock market performance leading up to an election has also been a major indicator of the outcome. The performance of the S&P 500 in the three months before votes are cast has predicted 87% of elections since 1928 and 100% since 1984. When returns were positive, the incumbent party wins. If the index suffered losses in the three-month window, the incumbent loses.


Tonight, we leave the party like it’s 1999

Today, U.S. stock valuations are at ridiculous levels against a backdrop of a global pandemic and global recession. U.S. Treasury bonds – typically a reliable counterweight to risky equities in a market sell-off – are the most expensive they’ve been in U.S. history, and very unlikely to provide the hedge that investors have relied upon.

This is the perfect time to look unconventional, just like in 1999. At today’s valuation spreads, the opportunity set is actually even better. And for those portfolios that are essentially benchmark-agnostic, we believe the opportunity set is the best we’ve seen in our working careers.

In 2020, the economy was destroyed by Covid-19; unemployment went from historic lows to historic highs in a matter of weeks. That should have reasonably dampened the market’s optimistic mood. But it didn’t (after the initial shock of March). The current valuation of the S&P 500 is actually higher than it was pre-Covid-19, which is dangerously odd given the sheer amount of uncertainty that exists (e.g., the shape of the economic recovery, the availability and efficacy of a vaccine, the risk of a second wave, U.S. citizens not adopting safety protocols, just to name a few). 

The real worrisome signs, however, are the increasing silly behaviors of a speculative market. Exhibit 7 is a prime example of the aggressive trading activity of retail investors. 


Though relatively calm for over a decade, this past spring awakened their animal spirits: daily trading activity increased nearly seven-fold over three short months. Bankrupted Hertz rallied 896% in May even though its own management team and the SEC said the company was likely worthless. Nikola, an electric truck maker with no actual earnings, no actual revenue, and…it’s true….no actual manufacturing facility to even make trucks, rallied 692% from April to early June. And then there was Tesla, which was bid up to $400 billion in market cap, making it more valuable than 12 established car companies, combined. The “You just don’t get it, GMO” taunts, the justifications, the mental gymnastics, the outrageous growth assumptions one needs to make to rationalize prices…it is all just too eerily reminiscent of 1999.


Americans have saved an extra $1.3 trillion since the pandemic

If household savings had grown in line with the recent pre-pandemic trend, Americans would have socked away about $2.2 trillion since the start of 2019. Instead, cumulative savings over that time period are worth just over $3.5 trillion. The difference—about $1.3 trillion—could pay for 9% of all the consumer spending that happened in 2019.


This savings boom had two basic causes. First, Americans cut their consumption dramatically. Part of what happened was that the higher-income people who were most likely to keep their jobs while working at home were also the people most likely to slash their spending on virus-sensitive categories such as dinners out and trips to the dentist. They were effectively forced to save because it stopped being safe to go out. Meanwhile, companies borrowed aggressively to offset the decline in sales while the government borrowed to offset the decline in tax receipts and pay for additional unemployment and welfare benefits. The net effect was that consumption spending fell almost 20% in the first wave of the pandemic.


Global energy consumption

Below are the IEA’s projections for electricity’s share of final energy consumption if countries stay on their current course (“Stated Policies Scenario”) and if countries meet the Paris Agreement goals (“Sustainable Development Scenario”). Under both scenarios, electricity’s share grows, but even under the Paris Agreement scenario its share is only 31% of total energy consumption by 2040. Under the Stated Policies Scenario it grows from 20% today to 24% by 2040.


Upstream oil investment needed to meet future demand